Presentation
The Net-Zero Donut® is a tool designed by the Sustainable Finance Observatory to monitor and assess the robustness and ambition of ‘net-zero’ commitments implementation by financial institutions.
It consists in four components:
- An exclusive framework assessed by PARC’s Scientific and Expertise Committee,
- An online interactive data visualisation tool,
- A dataset of currently 60+ financial institutions including 220+ indicators,
- Annual analysis reports based on this data.
It is co-funded by ADEME and led by the Sustainable Finance Observatory with the voluntary contribution of PARC’s Scientific and Expertise Committee and members of the Observatory. In 2024, the scope of study was expended to major European banks of the NZBA and extension to major European asset managers of the NZAM is planned for 2025. In the medium term, the project intend to cover all global major FIs and beyond net zero alliances members.
Aiming to go beyond individual commitments, the Net-Zero Donut® builds on the GFANZ Net-Zero Transition Plan and completes it by addressing all components of ‘net-zero’ commitments, from metrics and targets to engagement. It includes more than 220 indicators, 90% of which comprise an evaluation framework directly sourced with external recognised frameworks and recommendations. This exclusive framework was developed with the contribution of PARC’s Scientific and Expertise Committee. In its 2024 report, we focused on twenty major European banks that are members of the NZBA. In 2025 a report will be published covering thirty European asset managers. The framework will also be reviewed in light of recent evolutions within Net-Zero Alliances.
The Net Zero Donut methodology
Reading keys
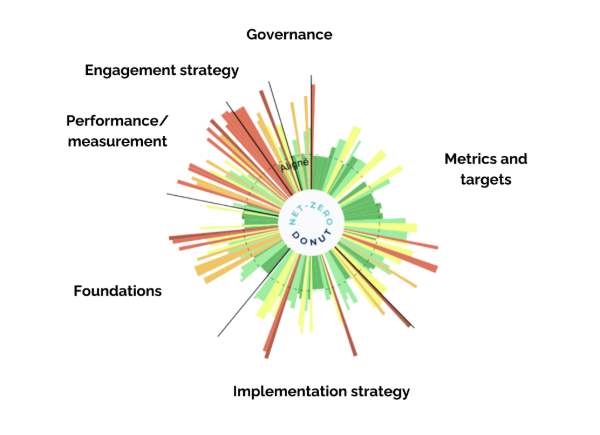
- The Net-Zero Donut is made up of all the indicators selected for each alliance, represented by a coloured area and classified into the 6 categories the framework.
- It is available for the financial institutions themselves, and in aggregated form for alliances.
- Each indicator is modelled by a thin slice representing the alignment or misalignment of the financial player with the reference framework, and respects the following colour code:
- Data found and evaluated: from Red to Green
- Data found but without a reference framework: Purple
- Data not found: Grey
- Indicator not applicable to the actor: White
- The indicator’s width depends to its relative importance, established by the number of external framework used that mentions them.
- The dotted circle represents the target to be reached. It delimits the area of the ideal donut for a financial institution analysed through the prism of the Net-Zero Donut.
Building the Net-Zero Donut framework
Use of reference frameworks
The indicators used for the construction of the Net-Zero Donut come from a variety of sources, according to their relevance to the study. Indicators are either directly adapted from an external framework’s recommendations or derived from the Observatory’s other studies. Each indicator is weighed according to the number of external frameworks they are referenced in.
Call to PARC’s Scientific and Expertise committee
The framework was reviewed by PARC’s Scientific and Expertise committee, to guarantee the methodological soundness of the study. The committee members participated in the overall definition of the final indicators as well as their evaluation frameworks.
To understand how it was constructed, dive into the methodology !
The data collection and analyses carried out as part of the Net-Zero Donut are the fruit of human endeavour. It is possible that some data points may have escaped the attention of the analysts who worked on the project, which is why we specify ‘not found’ rather than ‘not reported’. That said, these shortcomings cannot always be attributed solely to human error, but also to the clarity of the presentation of information in the reports and corresponding policies of the players. Indeed, the accessibility of information plays a vital role in stakeholders’ understanding of NZ targets, which is why we are calling for the publication of an annual public document bringing together all the data related to NZ ambition.
The Net Zero Donut dynamic visualisation tool is currently undergoing maintenance.